Venn diagrams are powerful visual tools that allow us to explore the relationships between different concepts. By using overlapping circles, we can clearly illustrate similarities and differences, making complex information more accessible and understandable. Whether you’re a student tackling a challenging math problem or a professional seeking to analyze market trends, Venn diagrams offer a versatile approach to visualizing connections and gaining valuable insights.
This article will delve into the fundamentals of Venn diagrams, exploring their construction and various applications. We’ll examine how they can be used to compare concepts, analyze relationships, and illustrate complex ideas across diverse fields. By understanding the power of Venn diagrams, you can unlock a new dimension in your ability to visualize and comprehend information.
Venn Diagram Basics
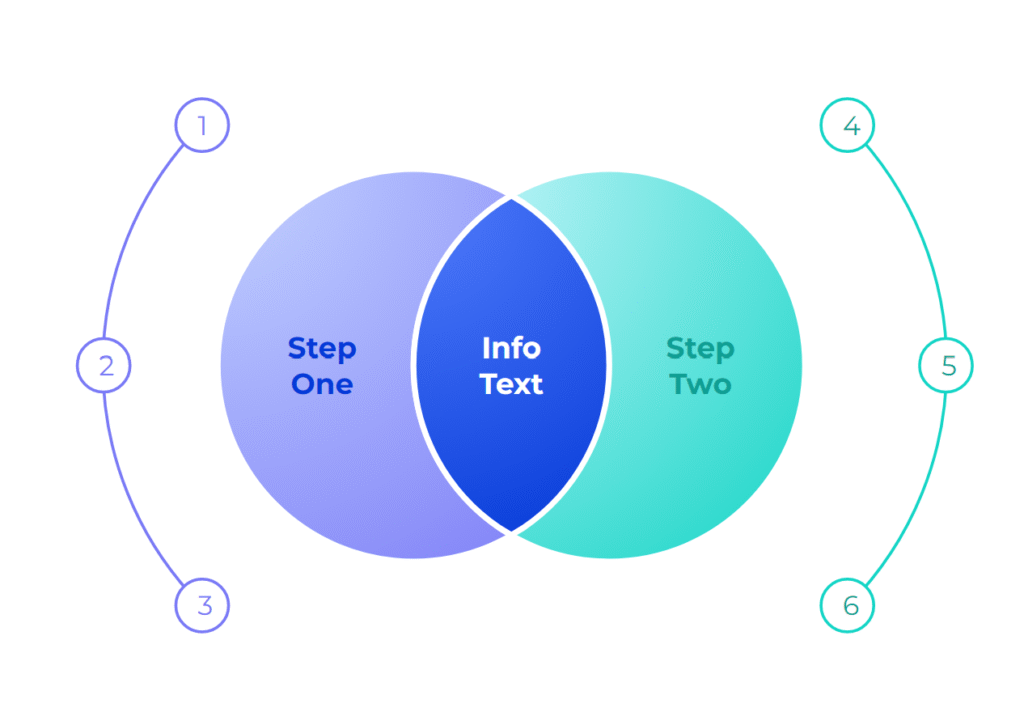
A Venn diagram consists of overlapping circles, each representing a distinct set or category. The overlapping regions represent the common elements shared by those sets, while the non-overlapping regions illustrate unique elements belonging to individual sets only. The number of circles used depends on the number of sets being compared. For instance, two sets are represented by two overlapping circles, three sets by three overlapping circles, and so on.
When constructing a Venn diagram, it’s crucial to clearly label each circle with its corresponding set or category. This ensures clarity and facilitates understanding. The overlapping regions should be labeled accordingly, indicating the elements shared by the respective sets. For example, if one circle represents “dogs” and another represents “cats,” the overlapping region would represent “animals.”
Comparing Concepts with Venn Diagrams
Venn diagrams excel at comparing and contrasting concepts, highlighting both similarities and differences. Consider comparing two subjects like “math” and “science.” A Venn diagram could illustrate their shared aspects, such as problem-solving skills and logical reasoning, within the overlapping region. The non-overlapping regions would represent unique characteristics of each subject, such as specific mathematical formulas or scientific theories.
Another example is comparing different types of music genres. A Venn diagram could depict “rock,” “pop,” and “classical” music, showcasing their shared elements like rhythm and melody in the overlapping regions. The distinct characteristics of each genre, such as guitar riffs for rock or orchestral instruments for classical, would be represented in the non-overlapping regions.
Analyzing Relationships Using Venn Diagrams
Venn diagrams are valuable tools for analyzing relationships between different entities. For instance, consider analyzing the relationship between “customers,” “products,” and “purchases.” A Venn diagram could illustrate how customers make purchases of specific products. The overlapping region would represent customers who have purchased a particular product, while the non-overlapping regions would show customers who haven’t made that purchase.
Similarly, a Venn diagram can analyze the relationships between “employees,” “departments,” and “projects.” The overlapping regions could represent employees working on specific projects within different departments, highlighting collaborative efforts. The non-overlapping regions would showcase employees solely dedicated to particular departments or projects.
Applications of Venn Diagrams

Venn diagrams find applications across diverse fields, including:
- Education: Comparing and contrasting concepts in various subjects like math, science, literature, and history.
- Business: Analyzing market segments, customer demographics, product features, and competitive landscapes.
- Research: Visualizing relationships between variables, identifying patterns, and exploring complex data sets.
- Healthcare: Illustrating patient diagnoses, treatment options, and potential side effects.
Benefits of Using Venn Diagrams
Venn diagrams offer numerous benefits:
- Enhanced Visualization: They transform complex information into a clear and concise visual representation.
- Improved Understanding: The overlapping nature of circles highlights similarities and differences, facilitating comprehension.
- Effective Communication: They serve as powerful tools for conveying ideas and relationships to others.
- Problem-Solving Aid: By visualizing connections, Venn diagrams can assist in identifying patterns and solving problems.
Conclusion
Venn diagrams are versatile visual tools that empower us to explore comparisons, analyze relationships, and illustrate complex ideas. Their ability to represent overlapping concepts and unique elements makes them invaluable for understanding connections and gaining insights across diverse fields. Whether you’re a student, professional, or simply seeking to enhance your analytical skills, mastering the art of Venn diagrams can significantly improve your ability to visualize and comprehend information.